


B2B Lead Generation Cost: How To Budget And Optimize Your Spend


Recent B2B benchmarks put the cost of a marketing-qualified lead at roughly $186 to $275, depending on the company profile and dataset.
The Norwest B2B Sales and Marketing Benchmark Report reported average costs per MQL of $186 to $269, depending on annual contract value. A separate analysis of 177 B2B SaaS companies found an average cost per MQL of $274.96 in Q2 2025.
These figures are useful reference points, but your real cost depends on what you count as a lead, how difficult your market is to reach, which channels you use, and how often those leads become opportunities and customers.
Quick takeaways
- Recent B2B benchmarks put the average cost per MQL at roughly $186 to $275.
- A lower CPL does not always mean a more efficient campaign. Cost per qualified meeting, opportunity, and customer usually matters more.
- Your true cost includes more than ad spend or agency fees. It can also include salaries, benefits, data, software, infrastructure, management, and sales follow-up.
- Retainers, pay-per-lead, pay-per-meeting, commission, and in-house teams create different incentives and should not be compared on headline price alone.
- The most reliable way to set a budget is to work backwards from your revenue target, average contract value, win rate, and funnel conversion rates.
This guide explains the benchmarks, hidden costs, channel differences, pricing models, and forecasting steps you need to estimate a realistic B2B lead-generation budget.
What Is Cost Per Lead, and What Should It Include?
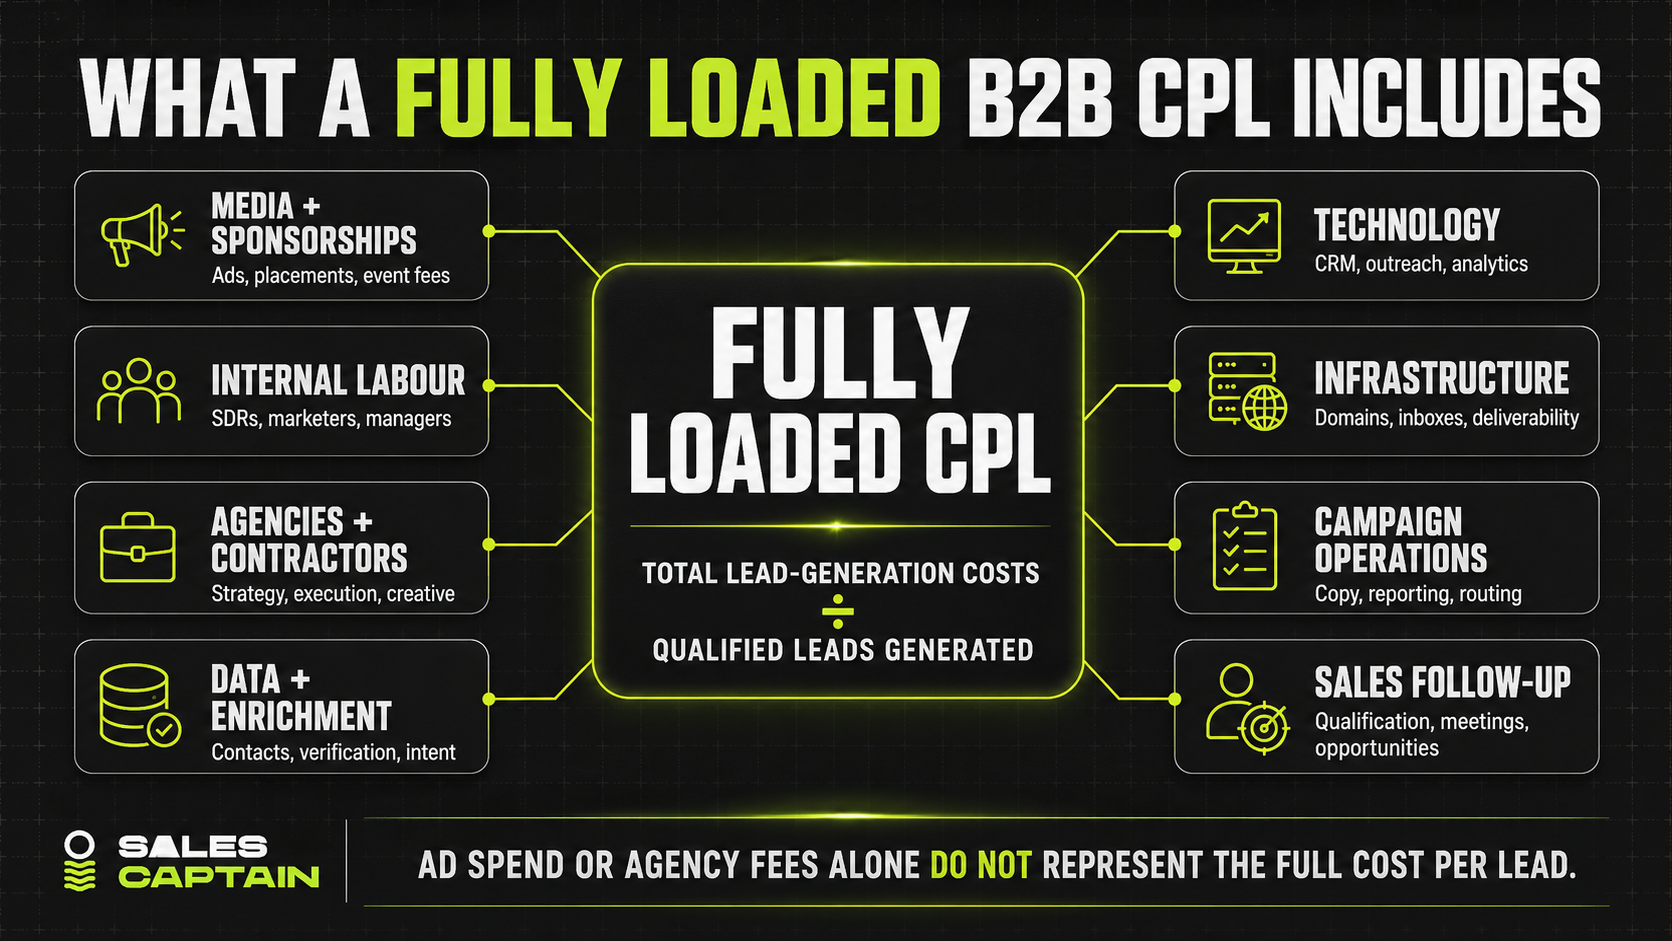
Cost per lead measures how much you spend to generate one lead. A fully loaded CPL should include the people, technology, data, infrastructure, and campaign work required to produce that lead.
CPL = total lead-generation cost ÷ number of leads generated
The formula is simple. Deciding what belongs in the calculation is not.
A narrow CPL calculation might include only ad spend or an agency fee. A more accurate calculation also includes the systems and operational work required to generate, qualify, and process those leads.
That can include:
- Advertising and sponsorship spend
- SDR salaries and employer costs
- Agency or contractor fees
- Data providers and enrichment tools
- CRM and outreach software
- Domains, inboxes, and deliverability monitoring
- Copywriting, content, and creative production
- Campaign management and reporting
- Recruitment, onboarding, and ramp time
- Sales time spent qualifying and following up
The lead definition matters just as much as the cost calculation. A raw contact added to a database is not equivalent to an inbound form submission, a marketing-qualified lead, or a sales-accepted opportunity.
Before comparing CPL figures, document exactly what qualifies as a lead. Our guide to B2B lead qualification explains how those definitions change as a prospect moves through the funnel.
CPL should also be reviewed alongside deeper-funnel metrics:
- Cost per qualified meeting: total spend divided by qualified meetings held
- Cost per opportunity: total spend divided by opportunities accepted by sales
- Customer acquisition cost: total sales and marketing acquisition cost divided by new customers
A campaign can show a low CPL while producing weak pipeline. I would rather pay more for leads that sales accepts than celebrate a cheap number built on contacts that never progress.
B2B Lead Generation Cost Benchmarks
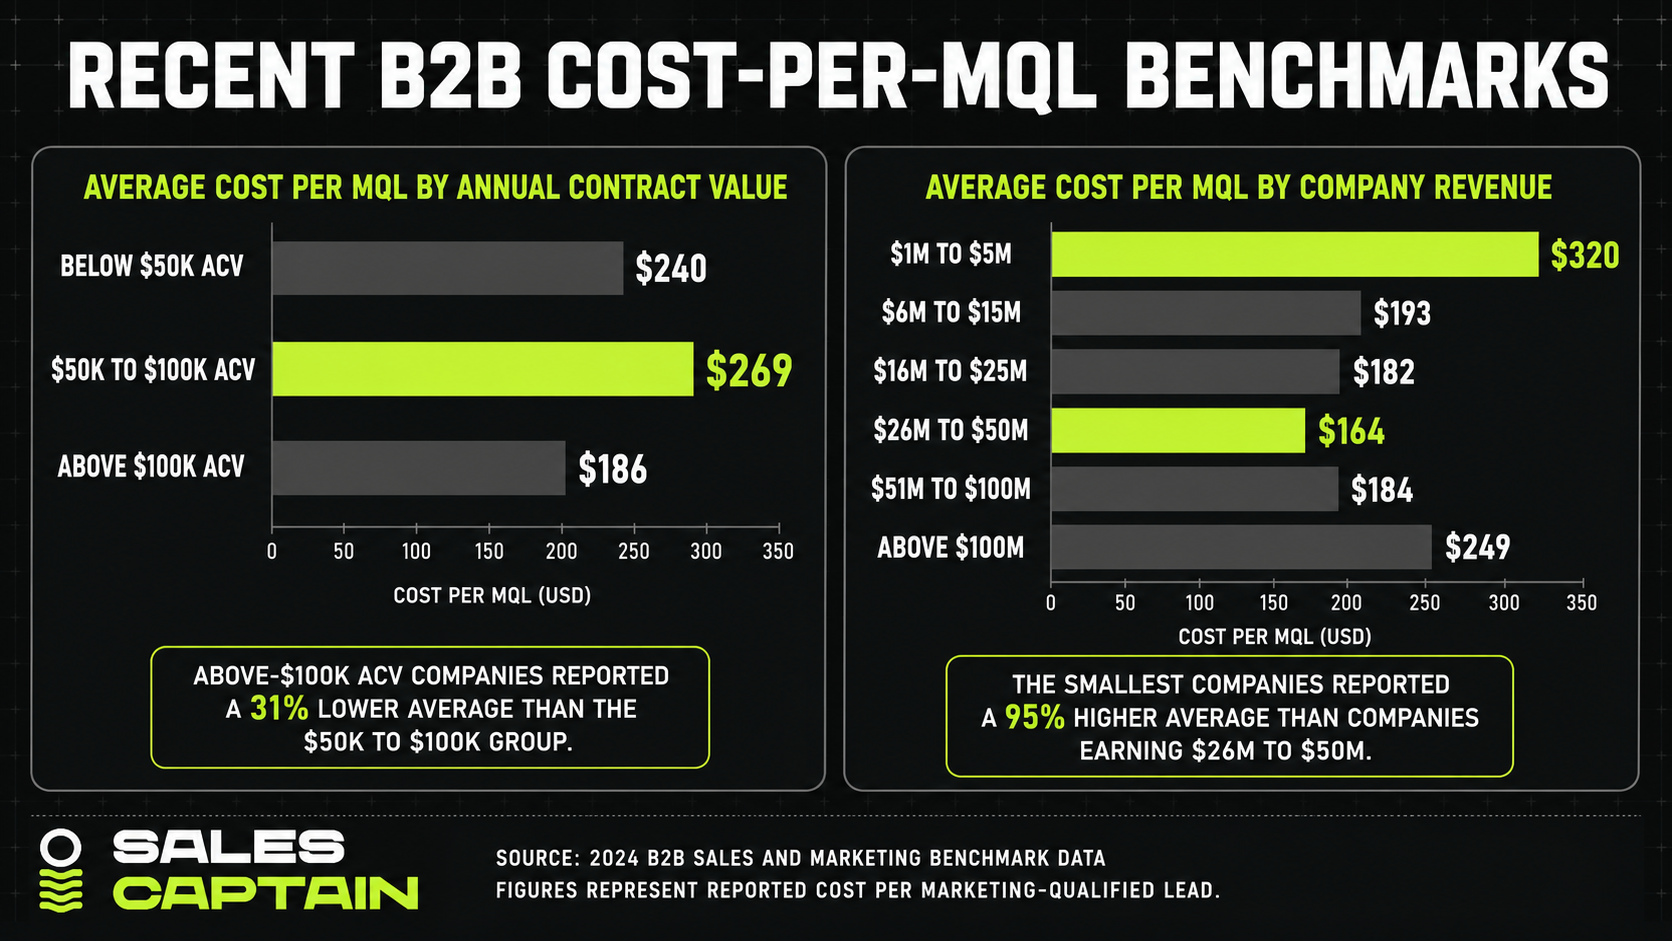
Recent benchmark data puts the average cost per MQL between $164 and $320, depending on company size, contract value, and dataset. These figures measure marketing-qualified leads, not raw contacts, booked meetings, or sales opportunities.
Average Cost per MQL by Annual Contract Value
The most recent B2B benchmark data reported the following averages:
The results do not show a simple relationship between contract value and lead cost. Companies selling contracts above $100,000 reported an average cost per MQL that was 31% lower than companies in the $50,000 to $100,000 group.
That does not prove that enterprise MQLs are cheaper. The difference may reflect channel mix, brand recognition, market maturity, qualification rules, or how each respondent calculated its costs.
Average Cost per MQL by Company Revenue
Company size produced an even wider range:
The smallest companies reported the highest average cost per MQL. Their $320 average was 95% higher than the $164 reported by companies earning between $26 million and $50 million.
Smaller companies may need to spend more while they test channels, build recognition, refine their targeting, and establish repeatable acquisition systems. That is my interpretation of the difference, not something the dataset proves on its own.
B2B SaaS Cost per MQL
A separate 2025 dataset covering 177 B2B SaaS companies reported:
- Q1 2025 cost per MQL: $297.48
- Q2 2025 cost per MQL: $274.96
- Quarter-over-quarter decrease: 7.6%
The dataset covered approximately $240 million in advertising spend.
Ad spend fell by 9.7% between the two quarters, while MQL volume declined by only 2.4%. This indicates that the companies generated MQLs more efficiently in Q2, although the data does not show whether those leads converted into better opportunities or more profitable customers.
Why Finance and Legal CPL Figures Need More Context
There is no defensible single CPL benchmark for finance or legal lead generation.
Public reports often combine consumer enquiries with B2B campaigns. A personal mortgage application is not comparable to an enterprise finance meeting. A personal injury form submission is also different from a demo request for legal software.
Before using an industry benchmark, check:
- Whether the campaign is B2B or B2C
- Which country the data covers
- How the source defines a lead
- Whether the metric covers a form submission, MQL, meeting, or opportunity
- Which costs were included
- Whether the result came from paid media, outbound, content, or another channel
A clearly defined benchmark is more useful than a precise-looking number built from incompatible leads.
How Lead Generation Costs Differ by Channel
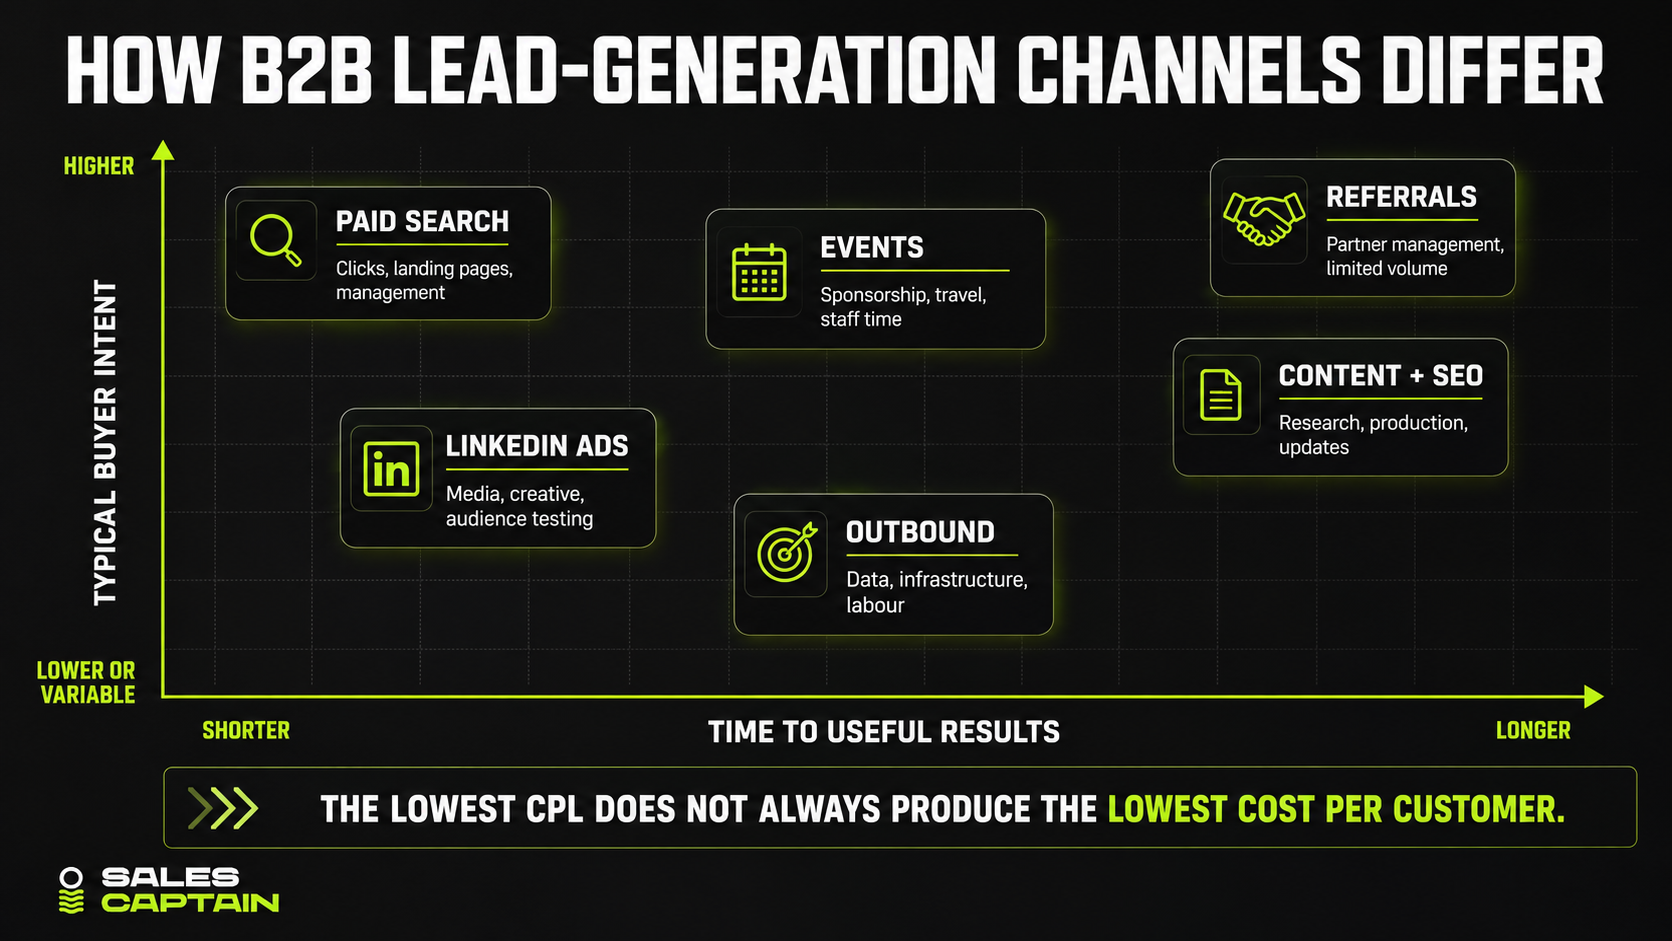
Lead-generation costs vary by channel because each method buys a different type of access to the buyer. Paid search captures existing demand, LinkedIn targets professional audiences, outbound reaches a defined market directly, and content builds demand over time.
CPL is useful for evaluating one channel over time, but it is unreliable for comparing channels that produce different types of leads.
The paid search and LinkedIn figures are cost-per-click benchmarks, not CPL averages. Comparable CPL data is not available for every channel because scope, labour, attribution periods, and lead definitions vary.
Paid Search
Paid search can generate leads quickly, but rising click costs can make it harder to maintain efficiency.
A 2025 benchmark of B2B non-branded search campaigns found that:
- Average CPC increased from $4.13 to $5.34, a rise of approximately 29%
- Average CTR fell from 5.47% to 4.04%, a decline of approximately 26%
- Non-branded search received 35.53% of measured B2B advertising budgets
Those figures measure clicks, not qualified leads. Landing-page conversion, qualification, CRM routing, and sales follow-up all affect the final cost per opportunity.
A separate $100 million B2B SaaS Google Ads dataset covering more than 50 companies reported:
- 19.53% average MQL-to-SQL conversion
- $8.17 in pipeline per advertising dollar
- $1.31 in revenue per advertising dollar
The difference between pipeline and revenue shows why a channel can appear efficient at the MQL stage while producing a much weaker return after deals close.
LinkedIn Advertising
LinkedIn offers precise professional targeting, but reaching the correct job title does not guarantee buying intent.
A $28 million LinkedIn Ads benchmark covering more than 70 B2B SaaS companies found:
- $10.48 average CPC in Q1
- $15.72 average CPC in Q3
- Q2 received 18% of annual spend but generated 30% of MQLs
- Q4 received 31% of spend but generated 20% of MQLs
The dataset counted high-intent actions such as demo requests, pricing-page visits, and contact submissions as MQLs. Ebook downloads and webinar registrations were excluded.
LinkedIn costs also include creative, audience research, landing pages, retargeting, attribution, and sales follow-up. It becomes wasteful when campaigns target the correct profile without a relevant trigger, problem, or offer.
Outbound Prospecting
Outbound pays for controlled access to a defined market rather than clicks or inbound form submissions.
Its cost may include data, enrichment, domains, inboxes, sales-engagement software, deliverability, segmentation, copy, campaign management, reply handling, and SDR qualification.
Our guide to the components of an outbound technology stack explains how those systems fit together.
Dividing software costs by contacts reached produces a cost per contact, not a meaningful CPL. A better calculation is:
Outbound cost per qualified meeting held = total data, infrastructure, technology, labour, and management costs ÷ qualified meetings completed
Exclude unqualified bookings and no-shows. Otherwise, the campaign may look inexpensive while creating little usable pipeline.
Content, Events, and Partnerships
Content and SEO have higher upfront costs and longer ramp times, but successful assets can generate leads without a new charge for every visit.
The calculation should include research, writing, design, technical work, distribution, updates, and internal review time. In 2025 B2B content marketing research, 46% of marketers expected content budgets to increase, while 41% expected them to remain flat.
Events require a similarly complete calculation. Sponsorships, travel, staff time, materials, hospitality, and follow-up all belong in the total cost. Badge scans should not be counted as qualified leads unless the contacts meet the agreed standard.
Referrals and partnerships can generate strong conversion because trust already exists, but their volume is difficult to control. They may produce an excellent cost per customer without supporting the company’s full revenue target.
How to Compare Channels Fairly
Compare channels using:
- Cost per accepted opportunity
- Pipeline generated per dollar
- Customer acquisition cost
- Time to reliable results
The channel with the lowest CPL can still have the highest cost per customer. Budget decisions should follow opportunity quality, revenue, and payback rather than the cheapest top-of-funnel number.
What Influences B2B Lead Generation Costs?
B2B lead-generation costs rise when the audience is difficult to reach, qualification standards are strict, the market is small, or the campaign requires more research and manual work.
Two companies using the same channel can therefore report very different CPLs.
FAQs


RELATED ARTICLES
Lorem ipsum dolor sit amet, consectetuer adipiscing elit, sed diam nonummy nibh euismod tincidunt ut laoreet dolore magna aliquam erat volutpat.


.png)


